1 Progress in widening participation
1. The term 'widening participation' refers to activities
for improving the participation rates[2]
of people from under-represented groups by encouraging them to
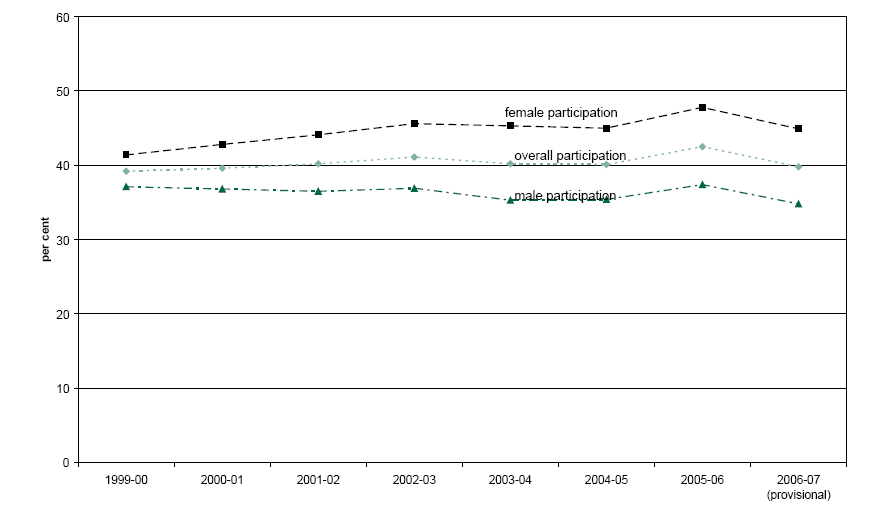
apply to higher education. Overall participation in higher education
has increased slightly over the past five years (Figure 1)
and the take up of places amongst women (Figure 1) and
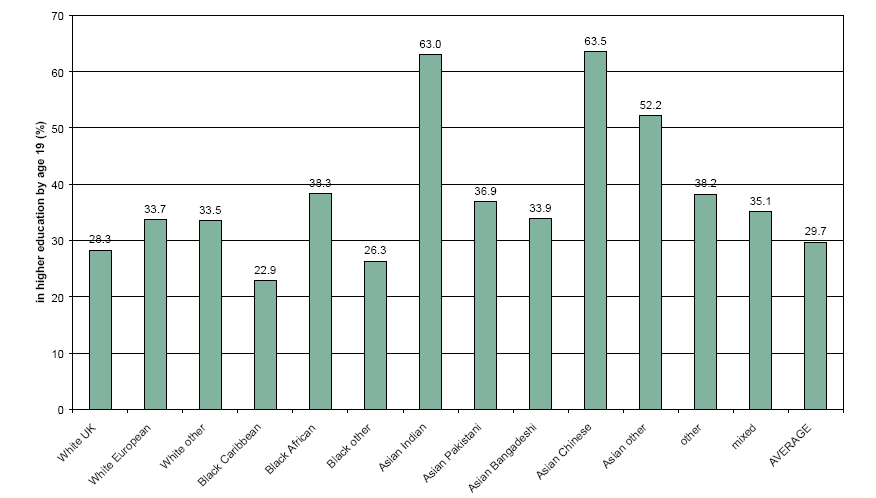
some ethnic groups (Figure 2) has been strong. In contrast,
participation rate of some groups remain poor, and people of white
ethnic background, particularly men, and people of black-Caribbean
origin are under-represented.
Figure 1—Higher Education Initial Participation Rate for England from 1999-2000 to 2006-07, split by gender

Note: the Higher Education Initial Participation
Rate measures the sum of participation rates for each age 17-30,
roughly equivalent to the probability that a 17 year old will
enter higher education by age 30. It is used to calculate progress
against the Department's Public Service Agreement target to 'increase
participation in higher education towards 50 per cent of those
aged 18-30 with growth of at least a percentage point every two
years in the academic year 2010-11'.
Source: Department for Innovation, Universities
and Skills, Statistical First Release: Participation Rates in
Higher Education: Academic Years 1999/2000-2006/07 (Provisional),
27 March 2008 available on http://www.dcsf.gov.uk/rsgateway/DB/SFR/s000780/index.shtml
Figure 2—Higher education participation rates up to the age of 19 by ethnic group

Source: Department for Innovation, Universities
and Skills analysis of linked data on higher education students
(Higher Education Statistics Agency) and school records (National
Pupil Database) 2005-06.
2. Progress in improving the participation of young
people from lower socio-economic groups[3]
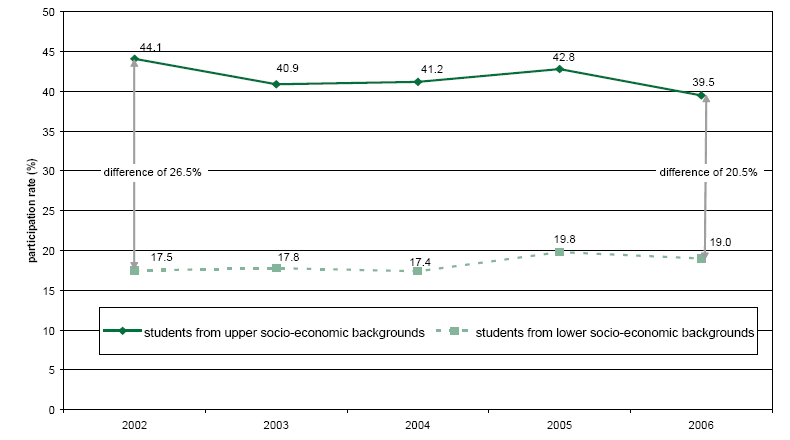
has been slow, although the gap between the upper and lower socio-economic
groups has narrowed (Figure 3). White males from lower
socio-economic backgrounds are significantly under-represented
in higher education, and are a challenging group.
3. The difference in rates of higher education participation
can largely be explained by differences in school attainment.
Low achievement by pupils at school is the principal explanation
for variation by socio-economic background. Two-thirds of those
with five or more GCSEs are in higher education by age 19 compared
with 12% of those without.[4]
There are virtually no differences in university acceptance rates
by socio-economic background when prior attainment is taken into
account.[5]
4. The level of deprivation in the area where an
individual lives affects educational achievement. The 20% of pupils
who live in the most deprived wards make up only 11% of those
who attain five or more GCSEs at school.[6]
The Office for Fair Access confirmed that deprivation also correlates
with other factors such as unemployment, dependence on welfare
and the stability of family structures.[7]
Figure 3—Participation rate of young, full-time students by socio-economic background

Notes: 'Upper socio-economic background' refers to
National Statistics Socio-Economic Class groups 1, 2, 3 and 'lower
socio-economic background' refers to groups 4, 5, 6, 7. The Full-time
Young Participation by Socio-Economic Class (FYPSEC) measure shows
the number of 18, 19 and 20 year old English—domiciled first
time participants in full-time higher education as a proportion
of the 18, 19 and 20 year old population of England, split into
participation rates for the upper and lower National Statistics
socio-economic groups.
Source: Data from Department for Innovation, Universities
and Skills, Full-time Young Participation by Socio-Economic Class
(FYPSEC), 2008 Update, 25 June 2008 available on http://www.dius.gov.uk/research/documents/FYPSEC%20paper%202008.pdf.
5. Many young people have low educational aspirations,
achieve poor levels of attainment and leave education at early
ages. They need better role models and universities need to be
encouraged to develop stronger links with schools. The Department
for Innovation, Universities and Skills (the Department) reported
that every university has some connection with schools, but the
activities that they provide differ. Although the relative effectiveness
of different activities is difficult to demonstrate there is some
evidence that mentoring schemes, where higher education students
provide support, encouragement and advice to school pupils, are
valuable.[8] However, not
every school is involved with a mentoring scheme.[9]
6. There is still latent demand for higher education,
although the Office for Fair Access believes it is probably unreasonable
to expect that people from upper and lower socio-economic backgrounds
will ever participate at equal rates.[10]
The Department has not set a maximum for participation rates above
which it thinks progress is unachievable, preferring to stimulate
demand rather than set targets for universities.[11]
7. Universities face the challenge of maintaining
student retention rates while also increasing and widening participation.
The Department confirmed that universities with higher proportions
of students from deprived backgrounds have higher drop-out rates,
mainly due to lower prior attainment.[12]
In its recent report on student retention, the Committee noted
that students from backgrounds without a family or school tradition
of participation in higher education are, on average, more likely
to withdraw from higher education. In recruiting them, universities
accept the risk of reducing overall retention rates.[13]
8. The Department does not routinely compare performance
in widening participation in England with other countries, principally
because of significant differences between educational systems.[14]
This may result in the Department not learning valuable lessons
from the experiences of others. There are large differences between
the participation rates of English regions, for example, young
people living in London are 50% more likely to enter higher education
than those in the North East. The Funding Council informed the
Committee, however, that once population composition (for example,
parental education levels) is taken into account, there are no
significant regional patterns to young participation rates in
higher education.[15]
9. The Department does not have data on backgrounds
and characteristics for a large proportion of students. Around
one-third of data on students' socio-economic background is missing,
principally because it is optional for applicants to declare their
parents' occupations at the application stage. This may affect
the accuracy of the reported trends in participation.[16]
The Department informed the Committee that some measures of participation
adjust for the impact of missing data by other means, for example,
through assigning students to a socio-economic group based on
their postcode.[17]
10. The Office for Fair Access stated that having
one or more parents who have been to university is a strong factor
influencing participation in higher education.[18]
UCAS[19] has recently
started collecting data on the parental education of applicants,
although it is optional for applicants to declare this information,
and a high proportion of applicants have declined to do so.[20]
11. The Department considers that the current economic
downturn is unlikely to reduce participation levels. Provisional
figures for applications for 2008-09 show an increase of 9.5%
on the previous year's figures.[21]
Historically, people are more likely to apply to undertake, and
stay in, higher education when employment is scarcer.[22]
At such times, people considering higher education are more likely
to think about which qualifications and subjects will be of long-term
value.[23] The Department
estimates that a graduate earns around £100,000 additional
net income over a lifetime compared with a non-graduate, although
this is an average figure which varies by subject, and probably
also by university.[24]
2 Participation rate is the proportion of a particular
group in higher education compared with the proportion in the
general population Back
3
Students from family backgrounds where the main wage-earner is
from one of the following: small employers and own account workers;
lower supervisory and technical operations; semi-routine occupations;
routine occupations. It refers to National Statistics Socio-Economic
Class groups 4, 5, 6, 7. Back
4
C&AG's Report, para 1.8 Back
5
C&AG's Report, para 1.7, Figure 7 Back
6
C&AG's Report, para 1.8 Back
7
Q 92 Back
8
C&AG's Report, para 2.28 Back
9
Q 22 Back
10
Q 94 Back
11
Q 93 Back
12
Qq 105, 144; Ev 20 Back
13
Committee of Public Accounts, Tenth Report of Session 2007-08,
Staying the course: The retention of students on higher
education, HC 322, para 6 Back
14
Qq 127-132 Back
15
Qq 123-125; Ev 20 Back
16
Q 120 Back
17
Qq 120-122 Back
18
Qq 101-102 Back
19
Formerly known as the Universities and Colleges Admissions Service Back
20
Ev 20 Back
21
Qq 10-15; http://www.ucas.ac.uk/website/news/media_releases/2008/2008 Back
22
Q 79 Back
23
Q 80 Back
24
Q 77 Back
| 


